All-in-one productivity toolkit for ambitious makers.
SparkVault Network Inspector
Monitor, inspect, and analyze network traffic efficiently in real-time for better
debugging and insights.
Last updated: Nov 12, 2025 • Created: Oct 28, 2025
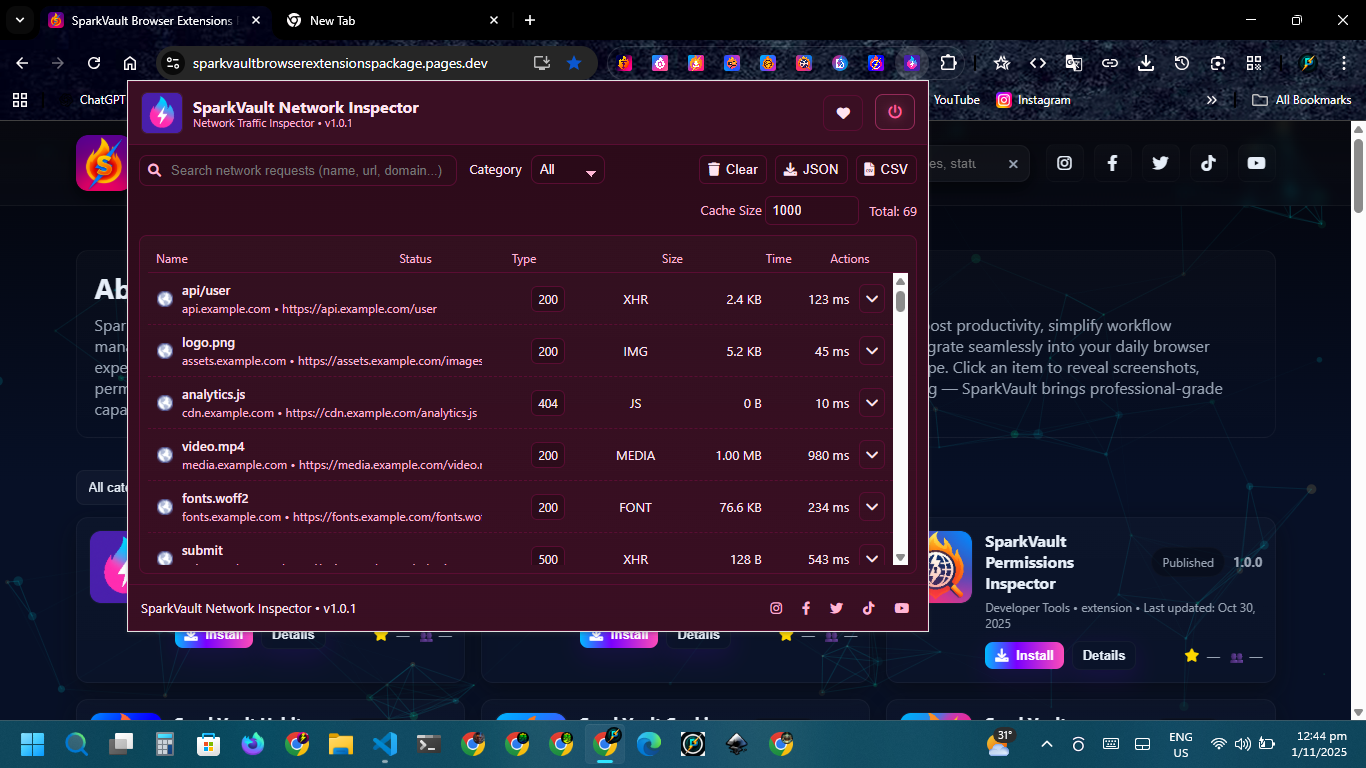
The SparkVault Network Inspector lets you monitor, analyze,
and export your browser’s network traffic in real time. Designed for developers, IT professionals, and
security researchers, it provides full visibility into all network requests with powerful search,
filters, and detailed inspection tools. Featuring real-time monitoring, exportable logs, and 11
customizable themes, it’s a lightweight yet professional-grade solution for debugging, auditing, and
optimizing web performance — all data stays local and private within your browser.
Screenshots
Features
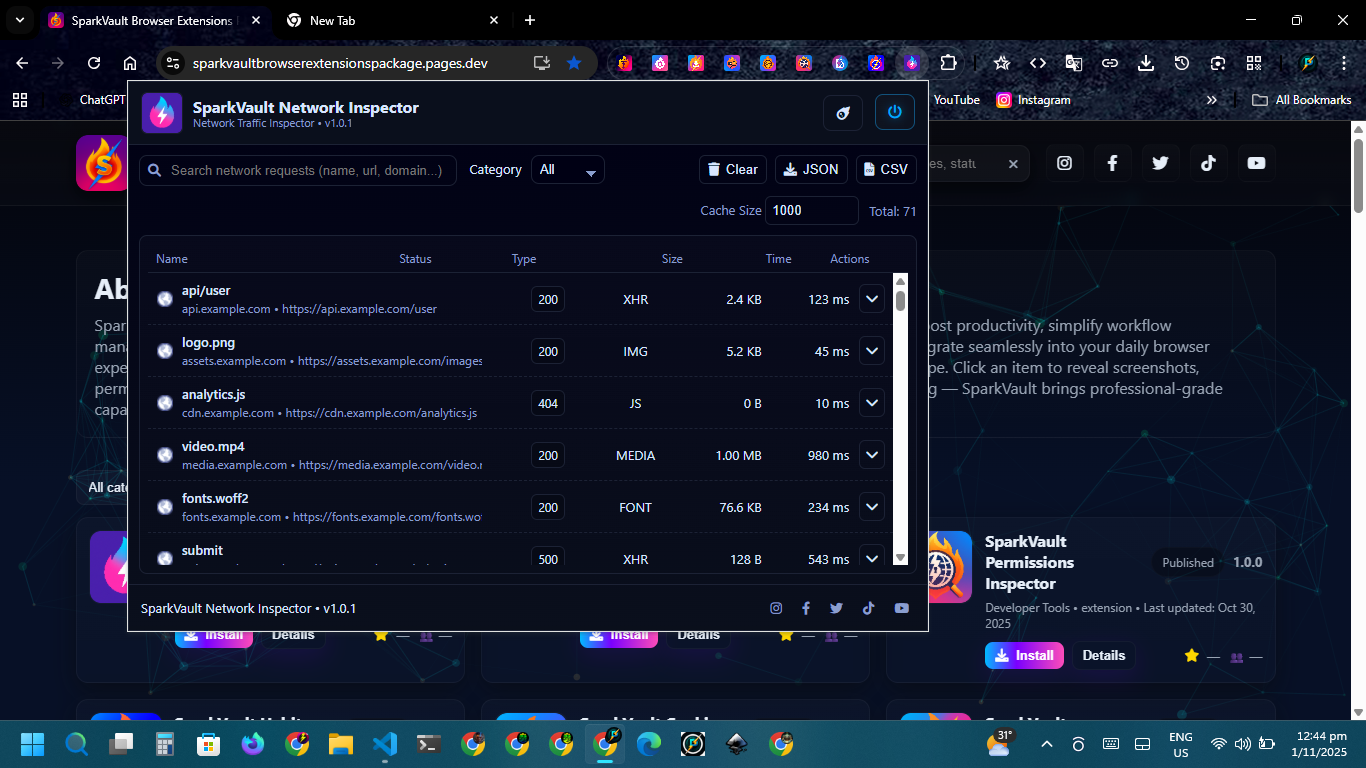
Real-Time Monitoring
Track all browser network requests as they happen with instant status and timing data.
Monitor XHR, JS, CSS, images, fonts, and media requests in real-time. Automatically categorizes
requests and updates continuously without manual refresh.
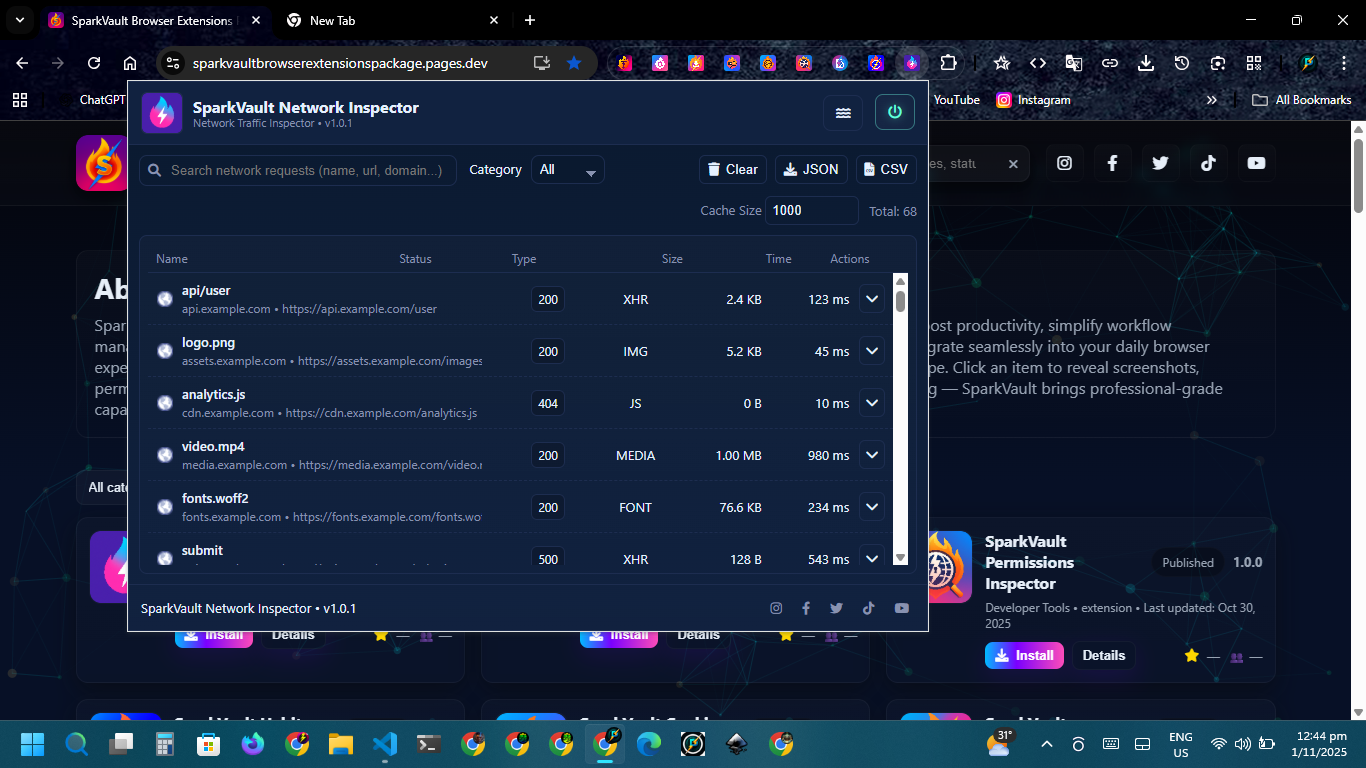
Auto Categorization
Requests are grouped automatically by type for faster navigation and clarity.
Requests are intelligently sorted into categories such as scripts, styles, media, and XHR calls,
helping you focus on specific types of traffic quickly.
Detailed Request Inspection
View complete request details including headers, methods, initiators, and timing.
Expand any request to see full metadata such as URL, method, initiator, duration, timestamp, and
headers. Visual domain indicators and favicons make analysis intuitive.
Advanced Search & Filters
Quickly find requests by type, domain, or keyword using flexible filters.
Combine multiple filters to locate specific network requests. Search by hostname, request name,
or URL, and filter by type such as XHR, scripts, or media.
Export & Backup
Save network logs as JSON or CSV for structured analysis and reporting.
Export captured traffic to JSON for development tools or CSV for Excel integration. Ideal for
audits, debugging sessions, and performance evaluations.
Configurable Monitoring
Toggle monitoring, set cache limits, and manage refresh behavior easily.
Enable or pause monitoring at any moment, set memory cache limits, and control automatic refresh
intervals to balance performance and precision.
Performance Tracking
Instantly view response times, request sizes, and status codes for optimization.
Real-time display of timing metrics and response data helps identify bottlenecks, failed
requests, and slow-loading resources quickly.
Domain Recognition
Identify requests easily with visual domain favicons and source indicators.
Each request displays its corresponding domain favicon and source host, providing quick visual
identification during network inspection.
Privacy & Local Storage
All captured data remains local — no uploads or external tracking.
SparkVault Network Inspector uses only essential permissions such as webRequest and storage. All
logs stay local, giving you complete control and data privacy.